28. Results
of the seismic analysis
The following table lists the steps and the sub-steps
used in the non-linear analysis for each seismic load combination.
|
Prevailing
earthquake along Z |
Prevailing
earthquake along X |
Prevailing
earthquake along Y |
|
% |
load step |
Sub
Step |
% |
load step |
Sub
Step |
% |
load step |
Sub
Step |
|
100% Gravity |
1 |
1 |
100% Gravity |
1 |
1 |
100% Gravity |
1 |
1 |
|
10%
Earthq. |
2 |
1 |
10%
Earthq. |
2 |
1 |
10%
Earthq. |
2 |
1 |
|
20%
Earthq. |
3 |
1 |
20%
Earthq. |
3 |
1 |
20%
Earthq. |
3 |
1 |
|
30%
Earthq. |
4 |
1 |
30%
Earthq. |
4 |
1 |
30%
Earthq. |
4 |
1 |
|
40%
Earthq. |
5 |
4 |
40%
Earthq. |
5 |
5 |
40%
Earthq. |
5 |
2 |
|
50%
Earthq. |
6 |
10 |
50%
Earthq. |
6 |
5 |
50%
Earthq. |
6 |
2 |
|
60%
Earthq. |
7 |
10 |
60%
Earthq. |
7 |
10 |
60%
Earthq. |
7 |
5 |
|
70%
Earthq. |
8 |
20 |
70%
Earthq. |
8 |
10 |
70%
Earthq. |
8 |
5 |
|
80%
Earthq. |
9 |
20 |
80%
Earthq. |
9 |
15 |
80%
Earthq. |
9 |
10 |
|
90%
Earthq. |
10 |
25 |
90%
Earthq. |
10 |
15 |
90%
Earthq. |
10 |
10 |
|
100%
Earthq. |
11* |
* |
100%
Earthq. |
11 |
20 |
100%
Earthq. |
11 |
10 |
|
110%
Earthq. |
12* |
* |
110%
Earthq. |
12 |
20 |
110%
Earthq. |
12 |
15 |
|
120%
Earthq. |
13* |
* |
120%
Earthq. |
13 |
30 |
120%
Earthq. |
13 |
15 |
|
130%
Earthq. |
14* |
* |
130%
Earthq. |
14 |
30 |
130%
Earthq. |
14 |
20 |
|
140%
Earthq. |
15* |
* |
140%
Earthq. |
15 |
30 |
140%
Earthq. |
15 |
20 |
* Load steps not performed because the structure
collapsed in the preceding steps.
At the Load Step no. 15 the 140 % of the seismic load
is reached (corresponding to the importance factor g I = 1.4).
29. Results for the load
combination with prevailing earthquake along Z
In this load combination the bridge is
loaded in its weakest direction.
The bridge collapses before reaching the
total design seismic load, at the load step no. 10 and sub-step no. 24,
reaching the 89.6% of the total seismic load (without the importance
factor). The bridge can resist against an horizontal acceleration of 0.314
g, as the spectral ordinate of the main mode of vibration is 0.35 g.
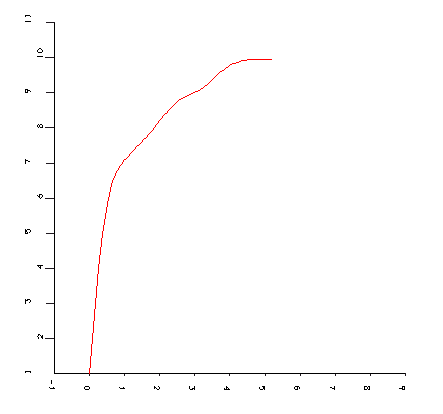
Load-displacement
diagram for the crown section (displacements in cm)
The structure behaves
linearly up to the load step no. 7, after the overall stiffness reduces.
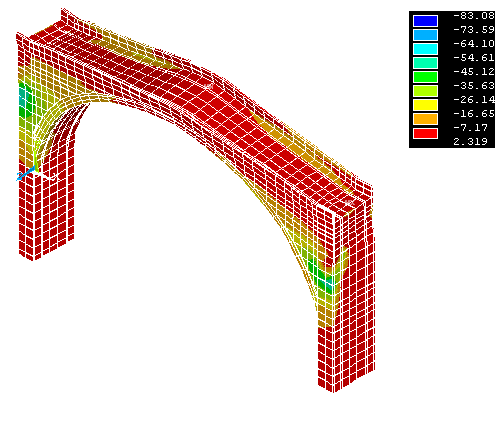
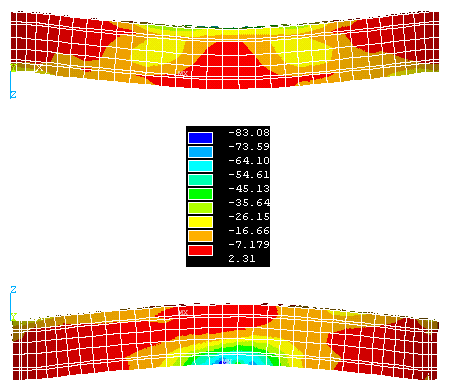
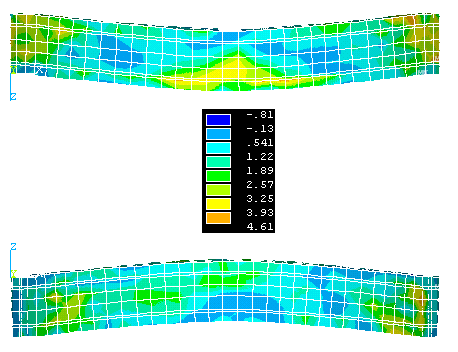
The following figures show the principal stresses S3, S2 and S1.
S3 Assonometric view at the load step no. 10 and sub-step
no. 24
S3 Extrados and intradox at load Step no. 10 and sub-step
no. 24
S2 Extrados and intradox at load Step no. 10 and sub-step
no. 24

S1 Extrados and intradox at load Step no. 10 and sub-step
no. 24
29.
Results for the load combination with prevailing earthquake along X
In this load combination the bridge is
loaded in its longitudinal direction. The bridge can support the whole
design seismic load in this direction (included the importance factor).
The analysis reaches the load step no.
15 and the sub-step no. 30.
The bridge can resist an horizontal
acceleration of 0.49 g, as the spectrum ordinate of the mode of vibration
considered is equal to 0.35 g.

Load-displacement
diagram of the cross section (displacements in 10-1 cm)
The bridge behaves linearly up to the load step no. 10,
later at the load step no. 11 the yield load is reached, with a reduction
of the overall stiffness.
The following figures show the principal stresses S3,
S2 and S1.
S3 Assonometric view at load step no. 15 e sub-step no. 30
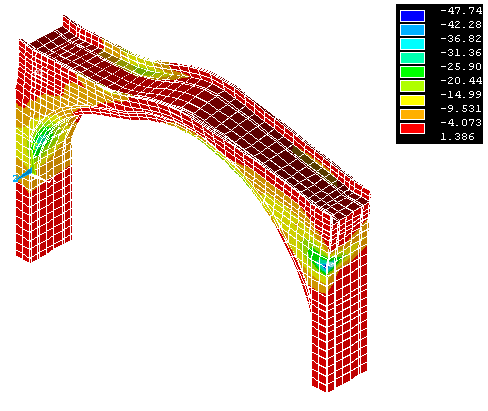
Under this load combination the bridge assumes the
typical anti-symmetrical configuration.
S3 Extrados and intradox at the load step no. 15 and
sub-step no. 30
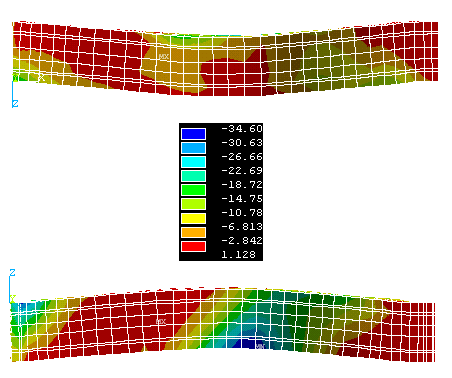
In the previous figures it appears clearly how the
tractions induced by the dead loads in the intradox of the bridge are
increased by this seismic load combination.
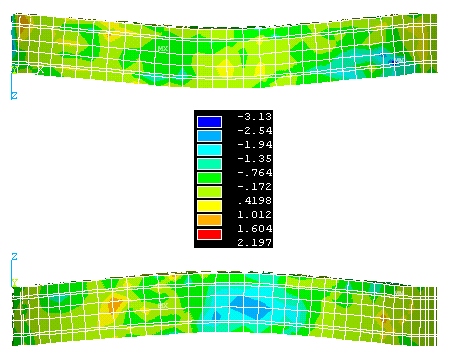
S2 Extrados and intradox at the load step no. 15 and
sub-step no. 30
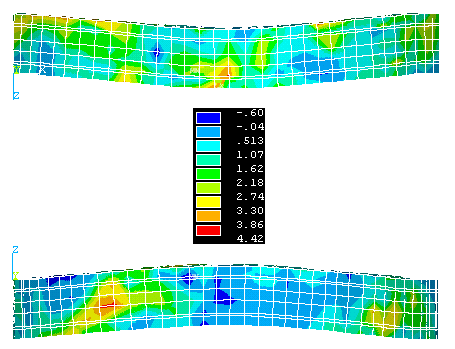
S1 Extrados and intradox at the load step no. 15 and
sub-step no. 30
30. Results for the load
combination with prevailing earthquake along Y
The bridge can support the whole design seismic load in
this direction (included the importance factor).
The arch tends to be unloaded and loses partly its
capacity of "redistribution and confining" of the tractions due
to the seismic components in the X and Z directions (present with a factor
of 0.3).
The analysis stops at the load step no. 15 and sub-step
no. 20, reaching the total design load.
The bridge can resist a vertical deceleration of 0.294
g, as the maximum spectrum ordinate of the considered mode of vibration is
0.21 g.
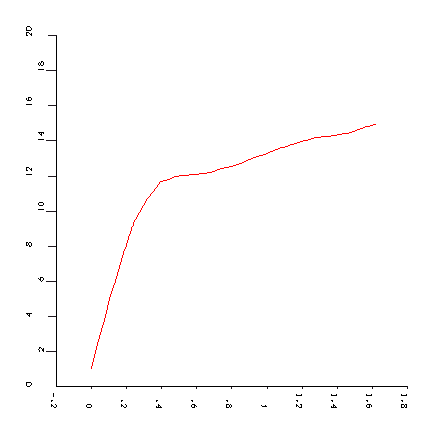
Load-displacement diagram of the crown (displacements in
cm)
The bridge behaves linearly up to the load step no. 11,
later at the load step no. 12 the yield load is reached and the overall
stiffness decreases.
The following figures show the principal stresses S3,
S2 and S1.
S3 Assonometric view at the load step no. 15 and sub-step
no. 20
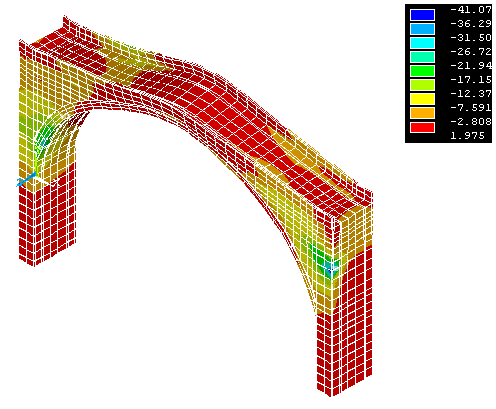
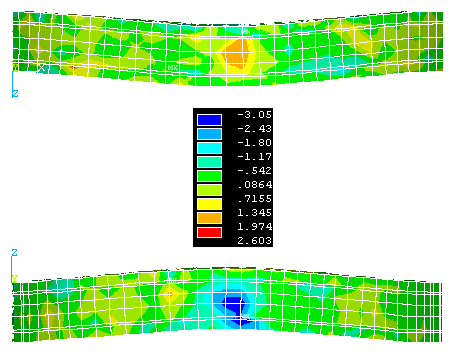
S3 Extrados (top) and intradox (below) at the load step
no. 15 and sub-step no. 20

S2 Extrados (top) and intradox (below) at the load step
no. 15 and sub-step no. 20
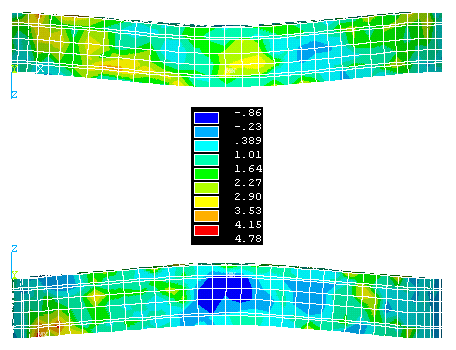
S1 Extrados (top) and intradox (below) at the load step
no. 15 and sub-step no. 20
|