18. Diffusion
of the thrust at the abutments
The F.E. model includes, as described above, the abutments up to a
distance of 6 m from the springers of the arch, so that it allows to
investigate how the thrusts diffuse into the abutments.
The stresses induced by the thrusts, under the dead and live loads, are
shown for each abutment at many sections. For each abutment the stresses
sx (where the axis x is longitudinal) on four vertical sections and the
stresses sy (where the axis y is vertical) on ten horizontal sections are
shown. The distance of each section from the springer is also given.

fig. 60 - FE model used to
calculate the diffusion of the thrust into the abutments
The diffusion of the thrust at the
abutments was determined for two load combinations:
- combination no. 1 B
- combination no. 5 C
It is interesting to notice that in the combination 1B,
when only the permanent loads and the uniform live loads act on the
bridge, the maximum vertical stresses are localised in the region
immediately close to the springer.
In the combination 5C the maximum stresses are shifted
towards the restraints at the end of both the abutments.
In all the sections the maximum tensile stress is lower
than the prefixed limit of 0.5 kg / cm2, in fact in all the
analyses the regions of the model subject to higher tractions were
disconnected (simulating the formation of cracks).
19.
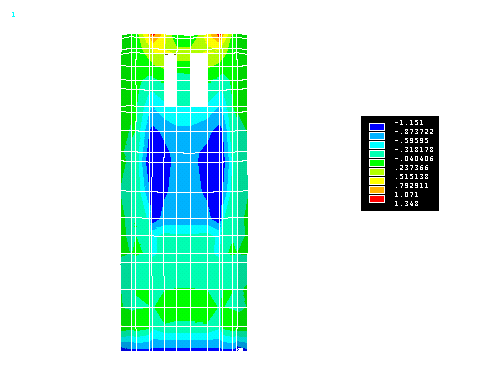
Stresses sx
- Left abutment - Load combination no. 1B
Left abutment Vertical
Section at 82 cm (load combination no. 1B)
- (sx
in kg / cm2)
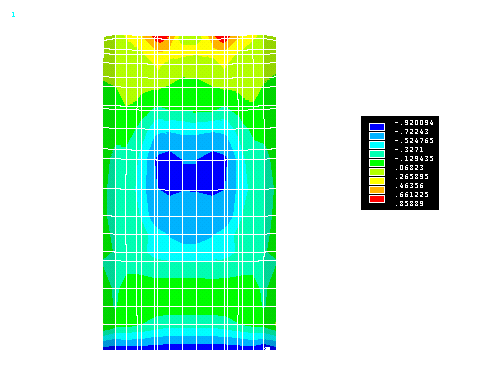
Left abutment Vertical
Section at 182 cm (load combination no. 1B)
- (sx
in kg / cm2)
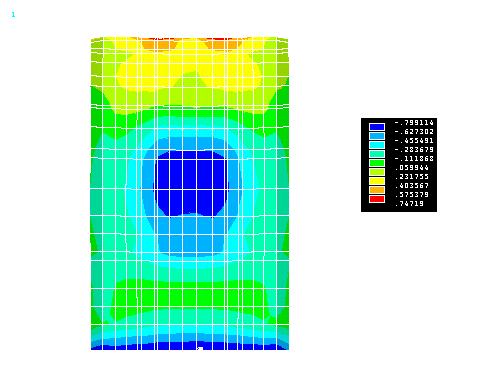
Left abutment Vertical
Section at 241 cm (load combination no. 1B)
- (sx
in kg / cm2)
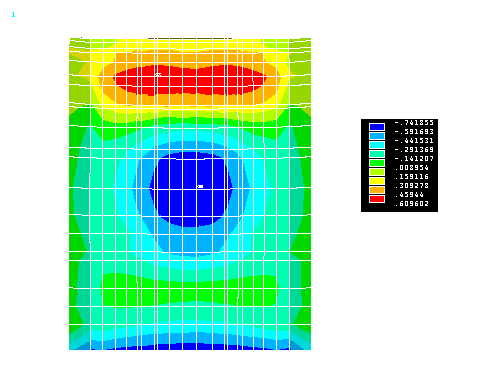
Left abutment Vertical
Section at 300 cm (load combination no. 1B)
- (sx
in kg / cm2)
Left abutment Vertical
Section at 400 cm (load combination no. 1B)
- (sx
in kg / cm2)

Left abutment Vertical
Section at 500 cm (load combination no. 1B)
- (sx
in kg / cm2)
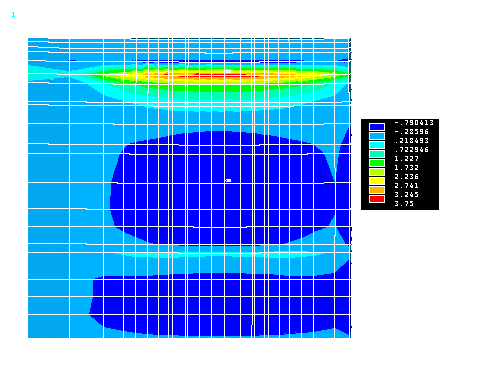
Left abutment Vertical
Section at 600 cm (load combination no. 1B)
- (sx
in kg / cm2)
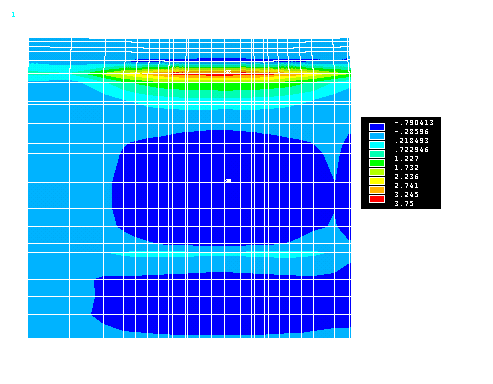
Horizontal
reactions at the left abutment (Load combination 1B)
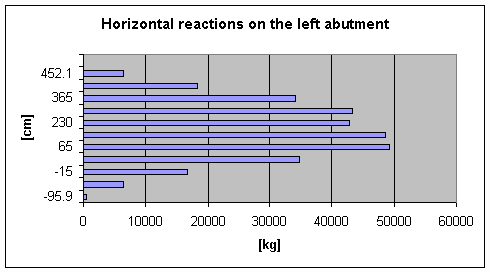
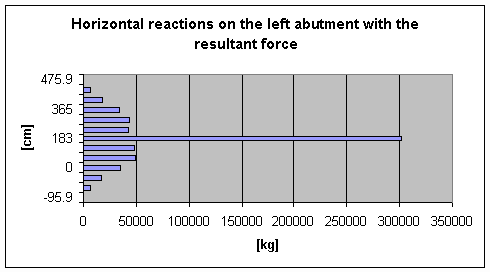
In the above diagrams the
level z = 0 corresponds to the level of the arch left springer. The values
of the horizontal reactions were evaluated at the initial section of the
abutment.
Vertical
reactions at the left abutment (Load combination 1B)

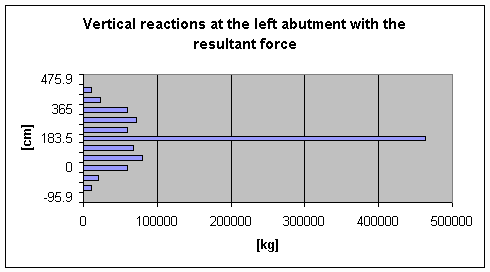
In the above diagrams the
level z = 0 corresponds to the level of the arch left springer. The values
of the vertical reactions were evaluated at the initial section of the
abutment.
20.
Stresses sx
- Right abutment - Load combination no. 1B
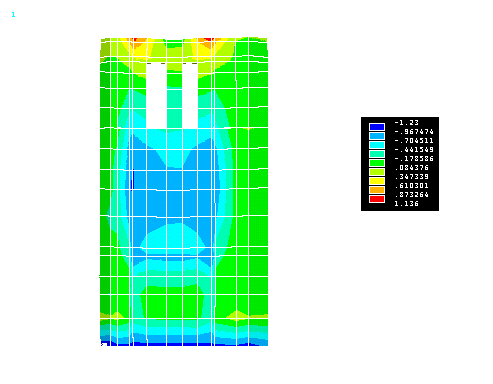
Right abutment Vertical
Section at 82 cm (load combination no. 1B)
- (sx
in kg / cm2)
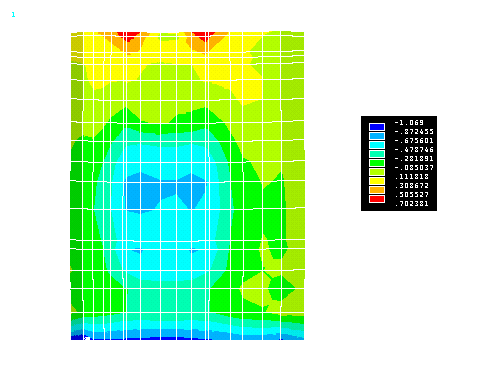
Right abutment Vertical
Section at 179 cm (load combination no. 1B)
- (sx
in kg / cm2)
Right abutment Vertical
Section at 240 cm (load combination no. 1B)
- (sx
in kg / cm2)

Right abutment Vertical
Section at 300 cm (load combination no. 1B)
- (sx
in kg / cm2)

Right abutment Vertical
Section at 400 cm (load combination no. 1B)
- (sx
in kg / cm2)

Right abutment Vertical
Section at 500 cm (load combination no. 1B)
- (sx
in kg / cm2)
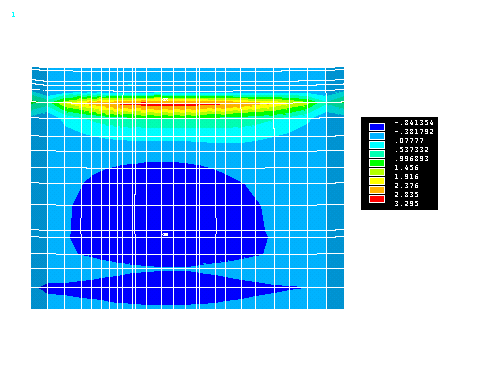
Right abutment Vertical
Section at 600 cm (load combination no. 1B)
- (sx
in kg / cm2)
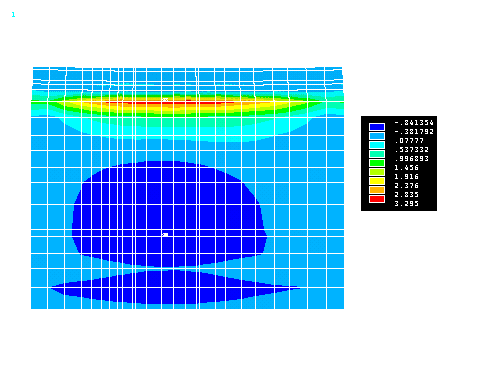
Horizontal
thrust at the right abutment (Load combination 1B)
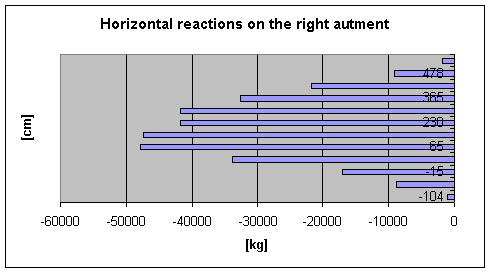
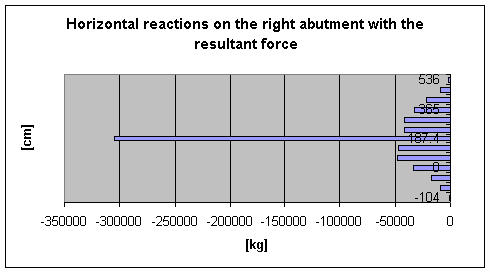
In the above diagrams the
level z = 0 corresponds to the level of the arch right springer. The
values of the horizontal reactions were evaluated at the initial section
of the abutment.
Vertical
reactions at the right abutment (Load combination 1B)
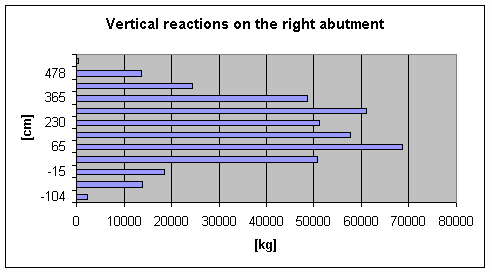
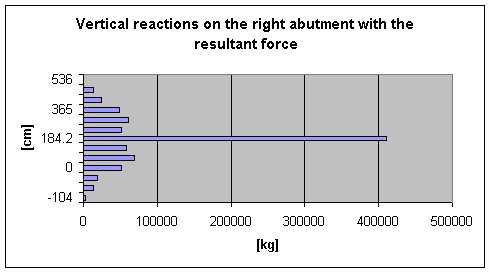
In the above diagrams the
level z = 0 corresponds to the level of the arch right springer. The
values of the vertical reactions were evaluated at the initial section of
the abutment.
|