12. Load combination
3B
- 1,35 permanent loads + 1,35 traffic loads on the whole bridge
- maximum value of the elasticity modulus for the arch and minimum
value for the other structural elements

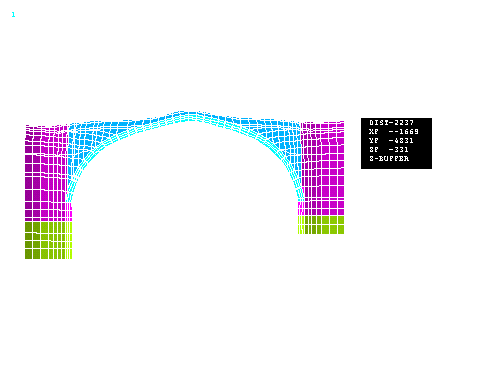
fig. 25 - deformed
configuration (load combination 3B)

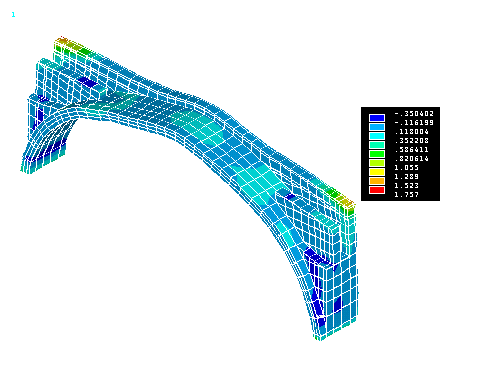
fig. 26 - principal stresses
S1 (load combination 3B)

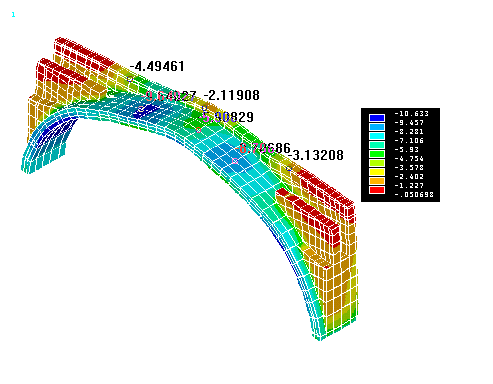
fig. 27 - principal stresses
S3 (in kg/cm2) (load combination 3B)

fig. 28 - principal stresses
S3 (in kg/cm2) (load combination 3B)

fig. 29 - principal stresses
S3 in the arch (in kg/cm2)

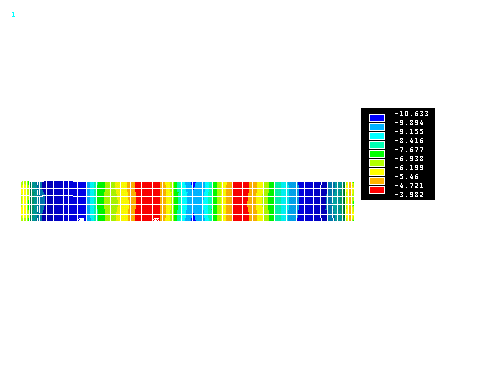
fig. 30 - principal stresses
S3 (in kg/cm2) at the arch extrados (load combination 3B)

fig. 31 - principal stresses
S3 (in kg/cm2) at the arch intrados (load combination 3B)
The main differences obtained between the
two analyses 3A and 3B are represented by the following variations of the
stresses:
- the maximum compressive stress at the
extrados of the arch in the region of the crown changes from –8.66
kg / cm2 (analysis 3A) to –9.64 kg / cm2
(analysis 3B), exhibiting a percentage variation of + 11.32 %
- the maximum compressive stress in the
spandrel decreases in the analysis 3B to the value of –7.17 kg / cm2
(with a percentage variation of - 24 % with respect to the analysis
3A)
These variations show how
much the model is sensible to the variation of the elasticity modulus of
the masonry:
an increase of the
elasticity modulus of the arch from 8000 MPa to 10000 (percentage
variation of +25 %) and the simultaneous reduction of the elasticity
modulus of the other elements (- 40 %) implies an increase of the stresses
in the arch of about 10 % and a reduction of about 25 % in the spandrels.
These results highlight the
importance of correctly evaluating the material characteristics to get
reliable results. Anyway the range of variation considered for the
elasticity modulus is so large that covers the uncertainties on the real
value of the elasticity modulus. Therefore, the results obtained can be
considered as upper limits for the compressive stresses in the masonry
produced by the permanent loads and the live loads.
|