5. Load conditions and
combinations
The load conditions and combinations were defined
according to Eurocode 1, in particular to Part 3 (ENV 1991-3: 1994) which
refers to the definition of the pedestrian, cycle action and other actions
specifically for footbridges. Eurocode 8 was referred to for the
definition of the earthquake actions.
In Eurocode 1 footbridges are categorised as:
- those on which pedestrian – and cycle traffic is not protected, or
not fully protected, from all types of bad weather, and
- those on which traffic is fully protected
Stari Most is of the first category.
For footbridges, wind and thermal actions are not taken
into account as simultaneous.
For the first category of footbridges (like Stari
Most), the traffic is considered incompatible with significant wind and/or
snow.
Load combinations
PARTIAL FACTORS, TABLE C.1 ENV 1991-3: 1994
|
|
SYMBOL |
P/T |
A |
|
permanent actions |
g g |
1,35 |
1,00 |
|
traffic loads |
g q |
1,35 |
1,00 |
|
other variable actions (snow, wind, temperature
effect) |
g q |
1,5 |
1,00 |
|
accidental actions |
g a |
--- |
1,00 |
y FACTORS FOR FOOTBRIDGES
|
|
y 0 |
y 1’ |
y 1 |
y 2 |
|
traffic loads |
0,40 |
0,80 |
0,40 |
0 |
|
wind |
0 |
0,6 |
0,5 |
0 |
|
temperature effect |
0 |
0,8 |
0,6 |
0,5 |
NB: y 1’ to define
infrequent loads
The following load combinations were defined, for the
ultimate limit states.
PERSISTENT / TRANSIENT DESIGN SITUATIONS

|
PERMANENT
LOADS |
TRAFFIC LOADS (*) |
SNOW |
WIND |
THERMAL EFFECT |
|
1,35 |
1,35 |
incompatible |
0 x 1,5 = 0 |
0 x 1,5 = 0 |
|
1,35 |
0,40 x 1,35 = 0,54 |
incompatible |
1,5 |
0 x 1,5 = 0 |
|
1,35 |
0,40 x 1,35 = 0,54 |
incompatible |
0 x 1,5 = 0 |
1,5 |
(*) to be considered on the entire bridge and on half the
bridge
ACCIDENTAL DESIGN SITUATIONS

|
PERMANENT
LOADS |
FLOOD |
TRAFFIC LOADS |
WIND |
TEMPERATURE EFFECT |
|
1,35 |
1,0 |
0,40 |
0 |
0,5 |
|
1,35 |
1,0 |
0 |
0,5 |
0,5 |
|
1,35 |
1,0 |
0 |
0 |
0,6 |
(wind and thermal loads have not to be simultaneous)
SEISMIC DESIGN SITUATION

|
PERMANENT
LOADS |
EARTHQUAKE |
TRAFFIC LOADS |
WIND |
TEMPERATURE EFFECT |
|
1,00 |
g I |
0 |
0 |
0,5 |
The load combinations with the wind loads were not
taken into account, as the bridge was checked against the accidental loads
due to the flood and the earthquake, which are more onerous.
Load conditions
The following load conditions were considered:
- dead and permanent loads
- live load uniformly distributed over the whole bridge
- live load uniformly distributed over half the bridge
- uniform thermal load +15 °C
- uniform thermal load -15 °C
- flood load
- earthquake load
a - Dead and permanent loads
The dead weight adopted for the masonry of the various
structural elements are listed in the following table.
|
|
|
type of stone used in the old bridge |
quality |
g
kg/mc |
|
1 |
Load-bearing arch |
TeneIija Cvrsta |
Excellent |
2200 |
|
2 |
Filling wedge |
TeneIija Mekša |
Ordinary |
2000 |
|
3 |
stiffening ribs |
TeneIija Mekša |
Ordinary |
2000 |
|
4 |
spandrels |
TeneIija Mekša |
Good |
2100 |
|
5 |
Additional masonry layer |
TeneIija Mekša |
Inferior |
1800 |
|
6 |
Horiz. stone slabs |
Krecnjak |
Good |
2100 |
|
7 |
Parapet |
TeneIija Mekša |
Good* |
2100 |
|
8 |
Filling material |
Variable |
Scarce** |
1600 |
|
9 |
abutments |
TeneIija Mekša |
Good |
2100 |
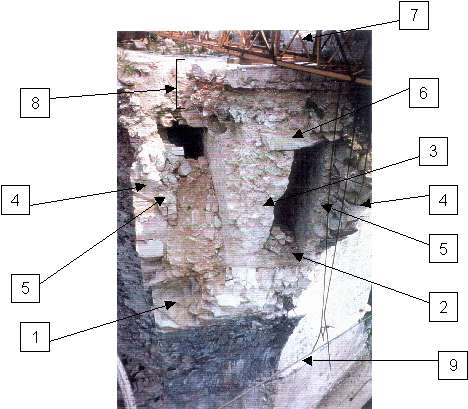
fig. 15 - Ruins of the bridge
arch: location of the main elements
b – Live load uniformly
distributed over the bridge
A uniformly distributed load of 5 kN / m2
was put on the whole bridge. EC1 allows for a reduction of this load for L
> 10 m, but in safety no reduction was applied even if the bridge span
is about 30 m.
c - Live load uniformly
distributed over half the bridge
A uniformly distributed load of 5 kN / m2
was put on half the bridge.
d – Thermal loads (+ 15 °C)
A uniform thermal load variation of +15 °C was applied
to the whole structure.
e - Thermal loads (- 15 °C)
A uniform thermal load variation of -15 °C was applied
to the whole structure.
f – Flood (2500 m3 /
s)
The actions due to the flood have been analysed
assuming a discharge between 1500 m3/sec and 2500 m3/sec,
with step of 250 m3/sec.
The discharge of 2500 m3/sec is the maximum
allowed between the abutments of the arch; the line of the specific loads
is tangent to the crown of the bridge itself.
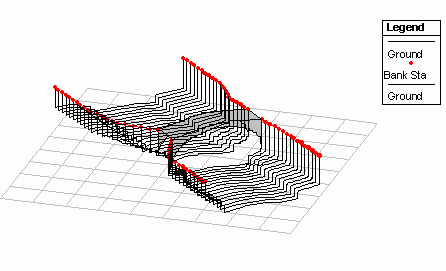
fig. 16 - Assonometric view of
the hydraulic sections used in the calculations
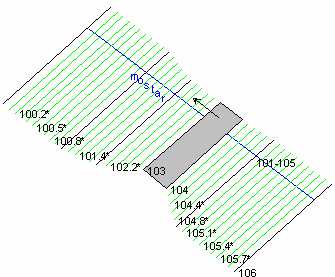
fig. 17 - Plan view of the
hydraulic sections used in the calculations
The hydraulic sections were obtained starting from the
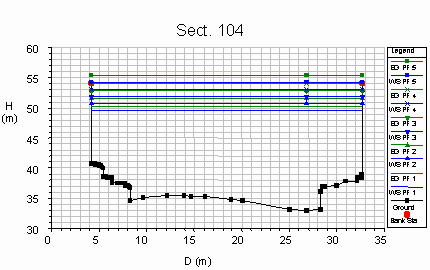
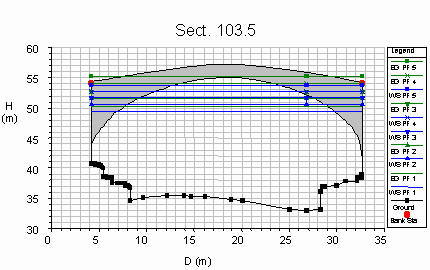
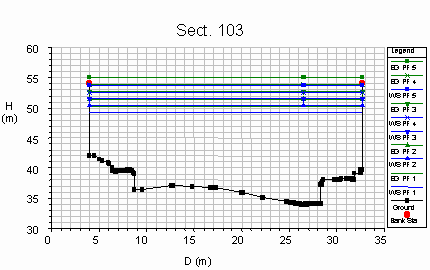
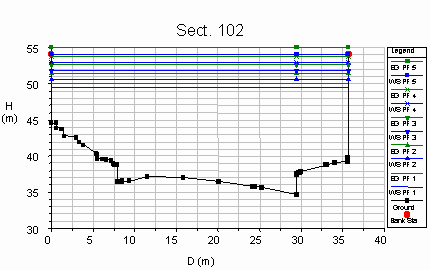
five available sections (101, 102, 103, 104, 105, in black). The deck of
the bridge is included between the sections 103 and 104, while the
abutments lay between the sections 102 and 105.
The bed profile of the river was drawn, allowing for the evaluation of the
mean slope.
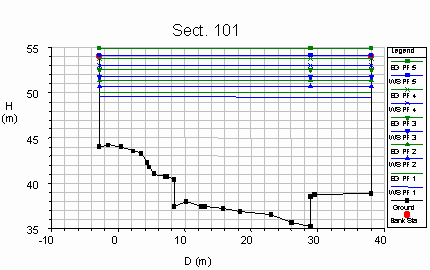
The flow is slow, the motion in the section no. 101 is
assumed as uniform with a mean slope of the riverbed if = 8.5 *
10-5.
A Manning coefficient of roughness n=0.03 s/m1/3
has been used, being the riverbed characterised by gravel and cobbles.
The following figures show the results of the performed
simulations, with the following list of the symbols used:
- the discharges associated to the profiles are indicated as:
|
Profile |
PF1 |
PF2 |
PF3 |
PF4 |
PF5 |
|
Q (m3/s) |
1500 |
1750 |
2000 |
2250 |
2500 |
- the water surface level WS corresponds to the blue line,
- the specific energy EG is represented in green,
- the talweg profile is in black and the red circles indicate the
maximum height of the lateral banks,
- D, H represent the coordinate system, measured from the mean sea
level and from the first left point of each cross section,
respectively.
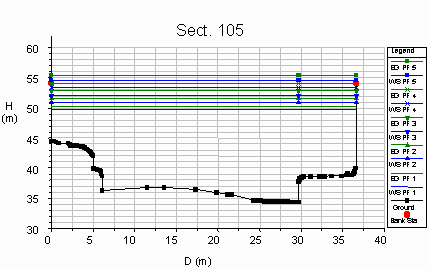
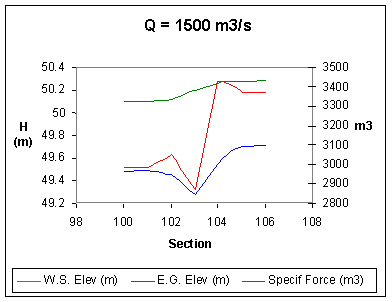
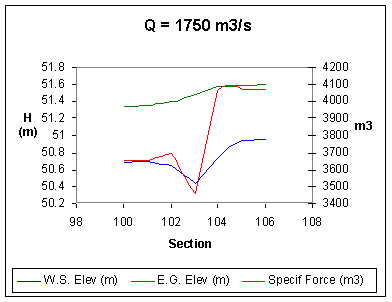
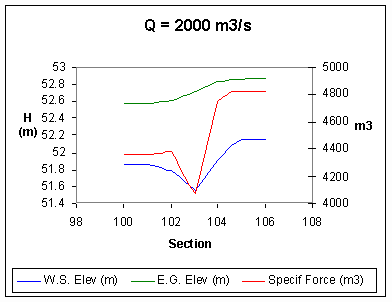
The following figures show
the result as the rate of the discharge varies. The profiles are also
reported in correspondence of the same values of the discharge.
- the water level is shown in blue and indicated with
the symbol WS,
- the specific energy in terms of height is represented
in green and indicated with the symbol EG,
- the specific force, force divided by the specific
weigth of the water [m3] is represented in red and
indicated with the symbol Specif Force,
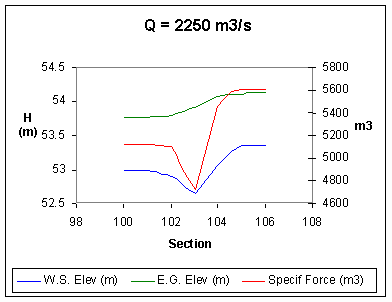
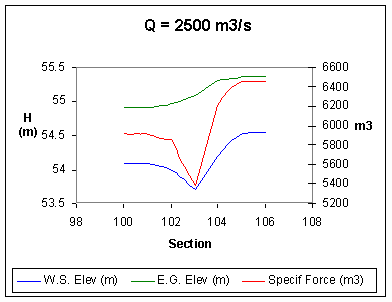
The force between the
section no. 105 and the section no. 103 is computed applying the momentum
theorem to the control volume bounded by these sections, neglecting the
shear stresses:
R = Su – Sd
where R is the resultant
action, S is the total force, the pedices u and d means the upstream and
downstream section, respectively. The total force can be written:
S = g
A yb + g
Q2 / (g A)
where
- g
is the specific weight of the water,
- A is the wetted area of the section,
- Yb is the depth of the
barycenter of the section,
- Q is the discharge,
- g is the acceleration due to the
gravity.
The pressure resultant on
the bridge is calculated, in safety, as the difference of the total
pressure of the flow (specific force multiplied by the specific weight
of the water) between the sections 105 (immediately upstream of the
lateral abutments) and 103 (immediately downstream of the bridge deck).
Such a resultant has been
considered acting uniformly on the surfaces of the wetted portion of the
abutments and of the bridge.
|
Q (m3/s) |
1500 |
1750 |
2000 |
2250 |
2500 |
|
Force 105 (ton) |
3368 |
4069 |
4816 |
5608 |
6449 |
|
Force 103 (ton) |
2874 |
3458 |
4074 |
4719 |
5393 |
|
Force on the bridge ton) |
|
|
|
|
|
Pressure forces
g - Earthquake actions
The structural behaviour of the bridge under the
seismic actions has been studied taking into account the non-linear
behaviour of the masonry, as it was done for the flood force.
A simplified modal response spectrum analysis has been
performed; this type of analysis can be used strictly speaking only to
structures whose response is not significantly affected by contributions
from higher modes of vibration.
In the analysis the X-axis coincides with the
longitudinal axis of the bridge, the Z-axis is in the transversal
direction and the Y-axis is vertical.
For each direction the mode of vibration considered is
the mode corresponding to the maximum participation factor.
Moreover the seismic actions of each direction have
been applied contemporarily on the F.E. model using the combination
factors of Eurocode 8.
|