5.6
Geometry determination: numerical analysis
Differences among drawings
had to be kept under control, documented and analysed, all this could not
be easily investigated by printing the results of the described work, this
because only the arch voussoirs are 456 and differences of few centimetres
have small dimensions compared to the global graphic representation of the
bridge which spans almost 29 meters. This has led to a numerical approach
which has been directly related to graphics: all the inserted data in CAD
have been exported in numeric charts and viceversa.
All this electronic charts
can give a synoptic view of all the steps that have been done, of all the
corrections that have been made and of all the incoherences and
differences found.
These charts have been
organised by arch voussoirs: every line represents an ashlar and it is
numbered both with current used numbers and with Roman numbers (like the
1955 survey); columns of the chart are generally X and Y co-ordinates of
the connections coming from the different surveys; next to these there are
"comparing columns" containing differences in centimetres.
Thank to this adopted
layout it has been easily possible to locate the most meaningful
differences, and this has finally led to the co-ordinates of the final
bridge configuration point by point. The charts moreover are so wide that
contain also data concerning the whole geometry of the bridge, the logical
structure and the main monitored aspects are here next listed:
charts structure
- ancient survey analysis - (data coming
from 1955 and 1982 surveys)
- survey comparing - (comparing among the
ancient survey data)
- direct survey data - (data directly
surveyed on the bridge remaining portions)
- 2000 survey - (the most likely bridge as
it was before destruction)
- verifies and checks - (checks and
verifies of the obtained results)
monitored data
- differences - (monitoring of differences
among data)
- incoherences - (worked out trough
specified methods and parameters)
- readability - (due to quality level of
the ancient documentation)
- reliability - (due to verifies and
checks held on the methodology followed for the survey)
- corrections - (carried out trough
specified procedures and after full data check)
- lacks - (parts of data not possible to
be determined)
The numerical charts are
the basis of the whole work, they have been started with all the available
input data and with the analysis work; during the developing of the phase
A they have been enlarged and right now they represent a full management
support for any kind of processing of the design and of the stone cut.
The charts have been
divided as follow, and each one contains input data, analysis data,
parameter checks, output results, comparing data :
- general variables
- intrados (north and south)
- extrados (north and south)
- intrados-extrados compare
- north-south compare
- archivolt
- design parameters – 2d & 3d
co-ordinates
- design parameters – stone cut and
stone quarry
The electronic numerical
charts are all logically connected and any modification of a value brings
all the others to a simultaneous recalculation. In the charts there are
special parameters that are monitored to check any anomaly that may lead
to constructive difficulties. At the end of the phase A, the numeric data
in the charts were thousands.
In order to satisfy the
need of full documentation of anything that has been done (restoration
principles do foresee this requirement), the numerical approach may be
itself a detailed report of the work, and the basis for a correct, exact
and scientific final design of the bridge.
In the following paragraphs
it will be given a detailed description of the most meaningful portions of
the charts, to report the main steps of the work.
5.6.1
Numeric intrados chart for the 1955 survey
One of the chart section
contains the input data of the 1955 survey, the chart is always structured
in the same way: each row represents a voussoir (or the first joint
beginning from the origin) and the columns contain data about the
co-ordinates of the joints and about the dimensions of the arch stones. Of
course the chart is identically repeated both for north and south
elevation.

fig.14 - A small portion of
the chart related to the 1955 survey north elevation
The above chart is here
next detailed explained:
- stone number: is a progressive number
which represents the arch stones but could be better referred to the
first joint of each stone (as it is represented in the drawings)
- roman number: is the same numbering
system adopted in the 1955 survey, and it has been maintained to allow
easier checks; it is referred to arch stones
- X global survey: it is the numeric value
that could be read on the ancient drawings about the X co-ordinates of
all the joints of the arch stones. The system had its origin on the
east arch springer (both for north and south side). It is a
"global" value since it gives information on global measures
of the arch shape point by point.
- readability: is a column which is
related to the previous data and may contain the following
conventional items: "?", "c", "x". The
first one ("?") means that the value could be hardly
readable from the ancient drawings and for this reason it is not sure;
the second one ("c") means that the value has been changed
or corrected due to obvious mistakes (better explained in the
followings pages); the last one ("x") means that the value
was missing and it has been replaced with a presumable dimension (see
next).
- Y global survey: as the above X global
survey but related to the Y dimensions.
- readability: as the above
- length global survey: is the value of
the length of each voussoir deduced by calculations from the X,Y
global survey co-ordinates; the simple calculation is the one reported
in §5.4.3 of this report.
- length local survey: is the dimension
that could be read on the 1955 survey next to each voussoir: it is a
local dimension since it is presumable that it was taken directly
stone by stone.
- readability: as the above
- differences: are the absolute values of
the difference among length global survey and length local survey. In
other words, if the values are equal, there would be a zero, if the
values are different there would be the difference of them without
sign.
- incoherences: it is an arbitrary
parameter of a practical and simple use: if differences are higher (or
equal) than cm 2.5 it gives "1", if they are lower it gives
"0". This is aimed to an easy and synoptic localisation of
the highest differences. The value of cm 2.5 has been chosen
arbitrary, and also because a wide percentage of the dimensions were
affected by small differences, (due to the survey method), that in
this type of analysis should not be considered.
The exposed chart is
precious for any type of analysis on the data and for their recording, but
for a complete check of the dimensions it has been necessary to insert the
above data in a CAD (Computer Aided Drawing) file, this way the
co-ordinates could be represented by a curve with no graphic error (which
is common in hand drawings). To avoid any mistakes the numbers have been
checked many times comparing the ancient surveys and the digital chart,
and for importing data in the CAD file it has been written a small LISP
routine (internal CAD language) that has allowed an automatic insertion of
data with no possibility of differences among the two digital systems.
The graphical
representation of the chart has allowed the location of incoherences due
to the inaccuracies of the original 1955 survey: some of the data were
clearly outside from the range of the bridge curve for this reason the
1955 survey has been in some cases corrected. Corrections have been made
following different methods depending on different elements and with an
interconnected system of verify: like interpolations with previous and
following data, verify with the results coming from the local length
dimensions, check with possible combination of similar numbers that may
have been misunderstood during the dimension transcription from the
original on site sketches. These corrections, (about 15 cases out of 448
dimensions) are not many, and have been documented in the readability
column.
Instead, some more were the
situation of hardly readability due the very bad condition of the drawings
of the survey, those data have been sometimes interpreted with the help of
the graphic checks and thanks to a comparing job with the local length
data.
Lacks were really a few,
and were all located close to the origin; this has helped very much in
solving the problem, since direct measure on the small portion of drawing,
which was belonging to the same piece of copy, has given good results
either with the graphic check either with the position of the springer.
All these cases have been
documented in the digital chart, so that nothing has been done without a
written indication, this is a methodology system that will allow any
future revision or check of the work.
5.6.2
Numeric intrados chart for the 1982 survey
While the 1955 survey,
being reliable for numeric dimensions only, was first mounted in a
numerical chart and then exported in a CAD file, the 1982 survey, being
graphically reliable and with no dimensions, has been first scanned, then
put in CAD as raster image, then vectorialised and finally exported in a
numeric chart for other checks. So the mentioned, (see §5.5.5 of this
report), numerical output has been automatically inserted in the numerical
chart, avoiding any possibility of error due to operator's wrong inputs.

fig.15 - A small portion of
the chart related to the 1982 survey north elevation
The chart is structured
identically to the one of the 1955 survey (global dimensions) and it is
repeated for north and south side of the bridge: each row represents a
voussoir (or the first joint beginning from the origin) and the columns
contain data about the co-ordinates of the joints and about the dimensions
of the arch stones.
The above chart is here
next detailed explained:
- stone number: as the 1955 survey chart
- roman number: as the 1955 survey chart
- X survey 82: it is the numeric value
that has been imported from the CAD vectorial drawing of the 1982
survey and represents the X co-ordinates of all the joints of the arch
stones. The system has its origin on the east arch springers (both for
north and south side) like the 1955 survey. It gives information on
global measures of the arch shape point by point.
- Y survey 82: as the above X global
survey but related to the Y dimensions.
- length: is the value of the length of
each voussoir deduced by calculations from the X,Y co-ordinates; the
simple calculation is the one reported for the 1955 survey (see
§5.4.3)
In this chart the parameter
of readability doesn't exist, since data were absolutely complete and with
no possibility of misunderstanding, due to the graphical origin of the
information. Although some dimensions, even here, have been corrected but
only next to the springers, where there were some graphic representation
problems (on the west side, north elevation there was a small ruined
portion of the arch and the last joints were not represented).
5.6.3
Survey comparing: intrados of 1955 and 1982
Anything that has been done
in the numeric chart was aimed mostly at the comparing phase, where all
the data coming from different sources may be related to understand what
kind of data we are using and how much reliable they are. Of course all
the compares have been made both on north and south side.
The first comparing chart
is the one that simply quantifies the differences among the X and Y
co-ordinates coming from the 1955 survey and from 1982 survey.
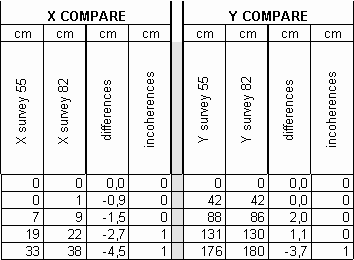
fig.16 - A small portion of
the chart related to the X,Y comparing of north elevation
The above chart is here
next detailed explained:
- X survey 55: is the X co-ordinates
coming from the 1955 chart
- X survey 82: is the Y co-ordinates
coming from the 1982 chart
- differences: are the values (with sign)
of the difference among the previous columns.
- incoherences: gives 1 if the absolute
value of the difference is bigger or equal to 2.5 otherwise it gives 0
- Y survey 55: is the Y co-ordinates
coming from the 1955 chart
- Y survey 82: is the Y co-ordinates
coming from the 1982 chart
- differences: are the values (with sign)
of the difference among the previous columns.
- incoherences: gives 1 if the absolute
value of the difference is bigger or equal to 2.5 otherwise it gives 0
Another interesting compare
is among the length calculated of the 1955 survey and the one calculated
of the 1982 survey. But maybe the most interesting, (next by to the
previous), is the comparing among the local length of the 1955 survey and
the length calculated using the 1982 survey.
In fact, in this last
chart, the measures that are compared are the most reliable ones that may
be gathered from the available sources.
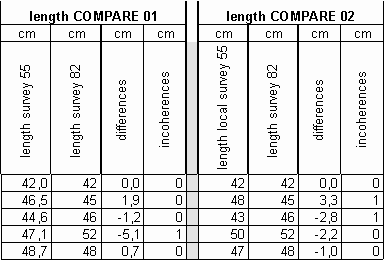
fig.17 - A small portion of
the two charts of length comparing of north elevation
The above charts are here
next detailed explained:
- length survey 55: is the calculated
length coming from the 1955 chart
- length survey 82: is the calculated
length coming from the 1982 chart
- differences: are the values (with sign)
of the difference among the previous columns.
- incoherences: gives 1 if the absolute
value of the difference is bigger or equal to 2.5 otherwise it gives 0
- length local survey 55: is the local
length coming from the 1955 chart
- length survey 82: is the calculated
length coming from the 1982 chart
- differences: are the values (with sign)
of the difference among the previous columns.
- incoherences: gives 1 if the absolute
value of the difference is bigger or equal to 2.5 otherwise it gives 0
5.6.4
Comparing results: intrados of 1955 and 1982 surveys
The above described
comparing systems and the global examination of the numeric chart have
been really precious to understand many useful things on the source data.
But to gather the meaning of the results of these charts it is important
to point out two main findings coming from the survey analysis:
- the most reliable data seems to be the
local ones for the 1955 survey and the global ones for the 1982 survey
- the 1982 survey is likely to be more
reliable than the 1955 survey
For the above reasons, the
X,Y compare among 1955 and 1982 has given bad results specially on the
north side on the Y dimension, and this was foreseeable since, as it has
been said in the survey analysis, the global co-ordinates coming from the
1955 survey may be affected by errors due to the way the survey was held.
Moreover it seems that during the on site survey of the 1955 there have
been on the north elevation a sort of origin shift: data in fact may be
compared successfully group by group. And it seems that this discontinuity
is approximately located every 10 meters.
One more confirmation of
the above is given by the 1955 survey itself: on an additional chart there
is reported a different dimensioning system of the arch profile which has
been mounted numerically in the CAD file and this is a lot better in the
area where the Y co-ordinates are in contrast with the 1982 survey.
Another observation that we
can make about the 1955 survey is that, after all the checks, corrections,
and verifies, the interior incoherences (among stone lengths measured
locally and lengths coming from the global calculation) are not so many
and not so high, this means that the most remarkable inaccuracies are
related to the co-ordinate system where a mistake may lead to invalidate
all the following metric data.
This is also confirmed by
an exceptional result: the sum of all the local lengths of each voussoir
gives good results in all the data systems and in both surveys: for the
north elevation varies from cm 4053 to cm 4058 while for the south
elevation it varies from cm 4034 to cm 4044.
But the most interesting
and useful result of all this work is contained in the last comparing work
chart, where there are only the most reliable measures of the 1955 survey
(local lengths) that have been related to the co-ordinates and calculated
lengths of the 1982 survey. The result is really extraordinary since
incoherences are really a few (7-8 per side) and most of them are couples
of adjacent cases of opposite sign. The meaning of this is clear: if a
joint is in the wrong position it generates two mistakes at the same time
(the first stone gets shorter and the second gets longer or viceversa). So
for each case found we had four measures (two local and two global) of the
1955 survey that could demonstrate that the 1982 survey in that point had
a small inaccuracy in the location of the joint. So we have a confirmation
of what it has been hypothesised during the 1982 survey analysis about the
surface details.
Followed methodology and
worked out hypothesis have been, at the end of the documented procedure,
partially verified, and have brought to the final intrados geometry of the
bridge: "the most likely bridge of Mostar" defined by the
"2000 survey" as it has been called in this work.
5.6.5 The
2000 survey and verifies - intrados
The "2000 survey"
is the conventional name here given for the geometry of "the most
likely bridge of Mostar" worked out trough the described procedures.
The 2000 survey is a virtual survey that derives from the analysis and the
study of the available data.
Corrections, (performed
following the method specified in the above paragraph), have been:
- only the ones where the 1955 survey had
no incoherences
- only where there were couples of equal
and opposite data
- all documented putting "c"
tags next to the values
- performed trough a geometric
construction to maintain unchanged the original curve profile coming
from the 1982 survey
- on the still existing portions measured
either with direct survey either with photogrammetry
After that a new chart has
been fixed with the results coming from this inquiry:
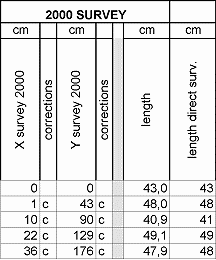
fig.18 - A small portion of
the 2000 survey chart and the measures coming from the direct survey of
north elevation
Another compare has been
made to check how the final situation was related to the ancient survey
best data, and this has been done either for the stones lengths, either
for the X,Y co-ordinates of the 1982 surveys, as showed in the following
samples of the charts.
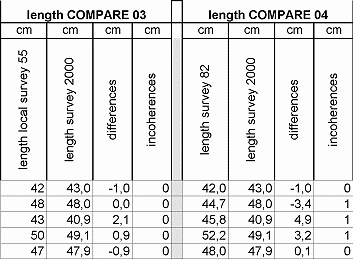
fig.19 - A small portion of
the comparing among 2000 survey and ancient data - north elevation
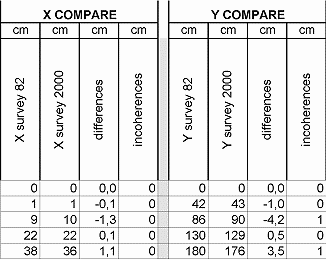
fig.20 - A small portion of
the comparing among 2000 and 1982 survey co-ordinates - north elevation
The 2000 survey is
therefore numerically defined for what concern the intrados lines of the
north and south side. But bridge geometry is not only that curve: many
other elements have to be considered.
5.6.6
Numeric extrados chart for the 1955 and 1982 survey
A similar analysis, to the
one of the intrados, has been performed for the extrados curves of the
bridge archivolt, north and south side.
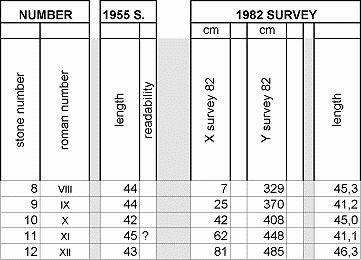
fig.21 - A small portion of
the chart related to the 1955 & 1982 survey north elevation extrados
curve
In this case the input data
were not so many, and the 1955 survey contained only a local measure
specification, while from the 1982 survey could be gathered the same type
of data available for the intrados curves.
Data of the extrados
analysis start from the 8th row about, and end at the 103rd
row; this because the ancient surveys contain no information related
to the interior portions, and the extrados curves ends are inside the
abutments, probably until the springers level.
The above chart is here
next explained:
- stone number: is a progressive number
which represents the arch stones but could be better referred to the
first joint of each stone (as it is represented in the drawings)
- roman number: is the same numbering
system adopted in the 1955 survey, and it has been maintained to allow
easier checks; it is referred to arch stones (rows)
- length: is the local dimension reported
on the 1955 survey
- readability: is a column which is
related to the previous data and may contain the following
conventional items: "?", "c", "x". The
first one ("?") means that the value could be hardly
readable from the ancient drawings and for this reason it is not sure;
the second one ("c") means that the value has been changed
or corrected due to obvious; the last one ("x") means that
the value was missing and it has been replaced with a presumable
dimension.
- X survey 82: it is the numeric value
that has been imported from the CAD vectorial drawing of the 1982
survey and represents the X co-ordinates of all the joints of the arch
stones. The system has its origin on the east arch springers (both for
north and south side) like the 1955 survey. It gives information on
global measures of the arch shape point by point.
- Y survey 82: as the above X global
survey but related to the Y dimensions.
- length: is the value of the length of
each voussoir deduced by calculations from the X,Y co-ordinates; the
simple calculation is the one reported for the 1955 survey (see
§5.4.3)
|